|
|
||
|---|---|---|
| README.md | ||
| cy.py | ||
| python-versions-pct.png | ||
| python-versions.png | ||
| python-versions.py | ||
| python-versions.sqlite | ||
README.md
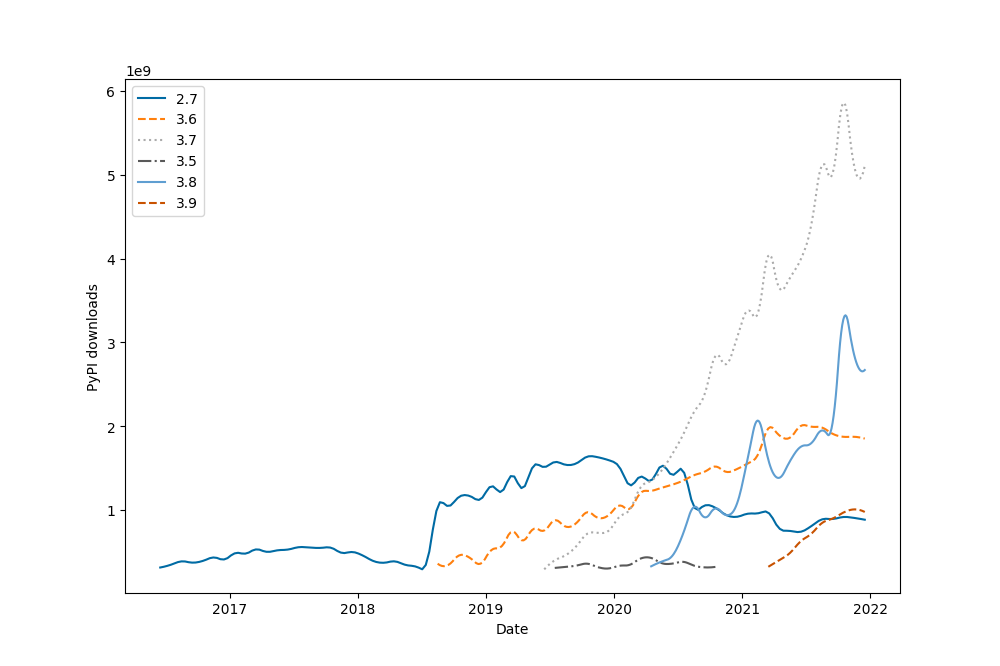
Analysis of version adoptions on PyPI
We get publicly available PyPI download statistics on Google BigQuery using pypinfo.
Here is the repo for the open-source code pushing the pypi stats to BigQuery.
Usage
First you need to get an access to PyPI's BigQuery, by following pypinfo procedure.
Then there's two main invocations, first fetch the data using:
python python-versions.py --fetch
Then plot it using:
python python-versions.py
Data
Percentage of pypi.org downloads

Number of pypi.org downloads